Diagram tasks: flowcharts, ERDs and sketches
Plenty of a computing specification is drawing rather than coding: a flowchart, an entity relationship diagram, a network topology. There are two kinds of diagram task and they suit different questions.
Written as text, rendered as a diagram
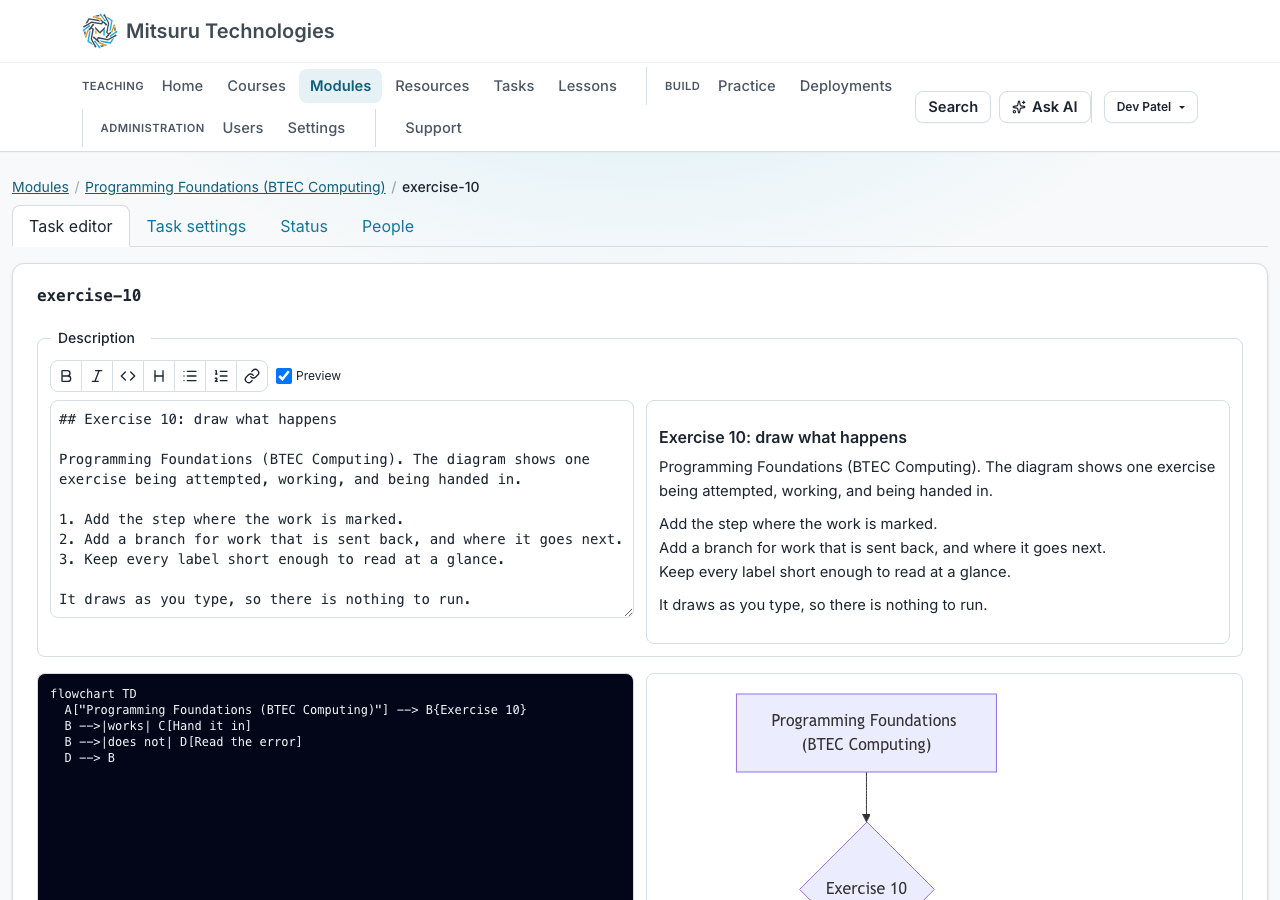
A Mermaid task is a diagram described in text, which the page draws as the student types. It is the right one for a flowchart or an ERD, because the text is reviewable and two students’ answers can be compared.
Drawn freehand
An Excalidraw task is a whiteboard. It is the right one for a network sketch or anything where the point is the layout rather than the syntax.
The whiteboard opens with 177 ready-made shapes for wireframes, cloud and system-design icons, forms, UML and ER notation and architecture diagrams, so a board is never blank. That library is fixed: it can be used but not added to or removed from. Open in a new tab gives a full-height canvas with nothing else on the page, saving to the same place.
A diagram task you open from a student is read-only, there to look at and not to fix, and diagram tasks are not shown in Live Classroom. A diagram inside a lesson is different: it is a block you add from the lesson builder, and in a student’s copy of the lesson you can draw on theirs.
Questions people ask
- Do students need an account with a drawing tool?
- No. Both are in the page, and the work is saved against the task like any other.
- Can a diagram be marked automatically?
- No, and neither claims to be. A diagram is marked by reading it.